• Skilled at using data to drive the narrative in global issues
• Use graphics, infographics, and animations to bring data-driven stories to life
• Apply storytelling across reports, websites, and videos
Data Storytelling Examples
Brief: Contextualise data in a visual story on emissions and carbon capture capacity for high profile talks by Cambridge University scientists
1. Mapping Emissions: Population vs Emissions (interactive)
• These interactive maps show the link between greenhouse gas emissions and population.
• You can compare total emissions with population using the arrow; especially India vs China, where emissions diverge despite similar populations.
• Use the third map to explore per capita emissions, with clickable, zoomable country-level insights.
2. Global Emissions Treemap (Interactive)
• I created this interactive treemap to group emissions by country and enable comparison with data on offsetting and deforestation.
• Click on a continent to explore more detail.
• We'll return to this tool later to add perspective.
3. Visualising the gap (video animation)
• I used Python, After Effects and Premiere to compare total global emissions (top line) with carbon capture capacity (CCS) (bottom line) in this animated graph.
• Since the scale difference is massive, it's impossible to put them on the same static y-axis - the CCS line just sits on the x-axis. I solved the issue with zoom transitions to make both trends visible.
• Used by senior scientists at the University of Cambridge in public talks, this graphic has shocked audiences by revealing the true gap.
4. Putting It in Perspective: Trees vs CCS (static)
This static treemap compares:
• Total carbon sequestered by trees annually
• Carbon offsetting lost to deforestation
• Global carbon captured by CCS (look closely - it’s tiny)
It asks a stark question: Why does so much climate mitigation policy rely on CCS capacity, yet deforestation continues?

5. Zooming Out: CCS vs Forests at Scale
• Revisit the interactive treemap: filter by continent and you’ll see that CCS offsets emissions equal to Singapore's output (population of 6 million people).
• Meanwhile, trees offset emissions of North and South America combined (population of 1 billion people).
The story becomes clear through a range of data visualisation techniques: preserving forests and reducing emissions must be central to climate strategy.
6. Other Work: Telling Stories Through Design
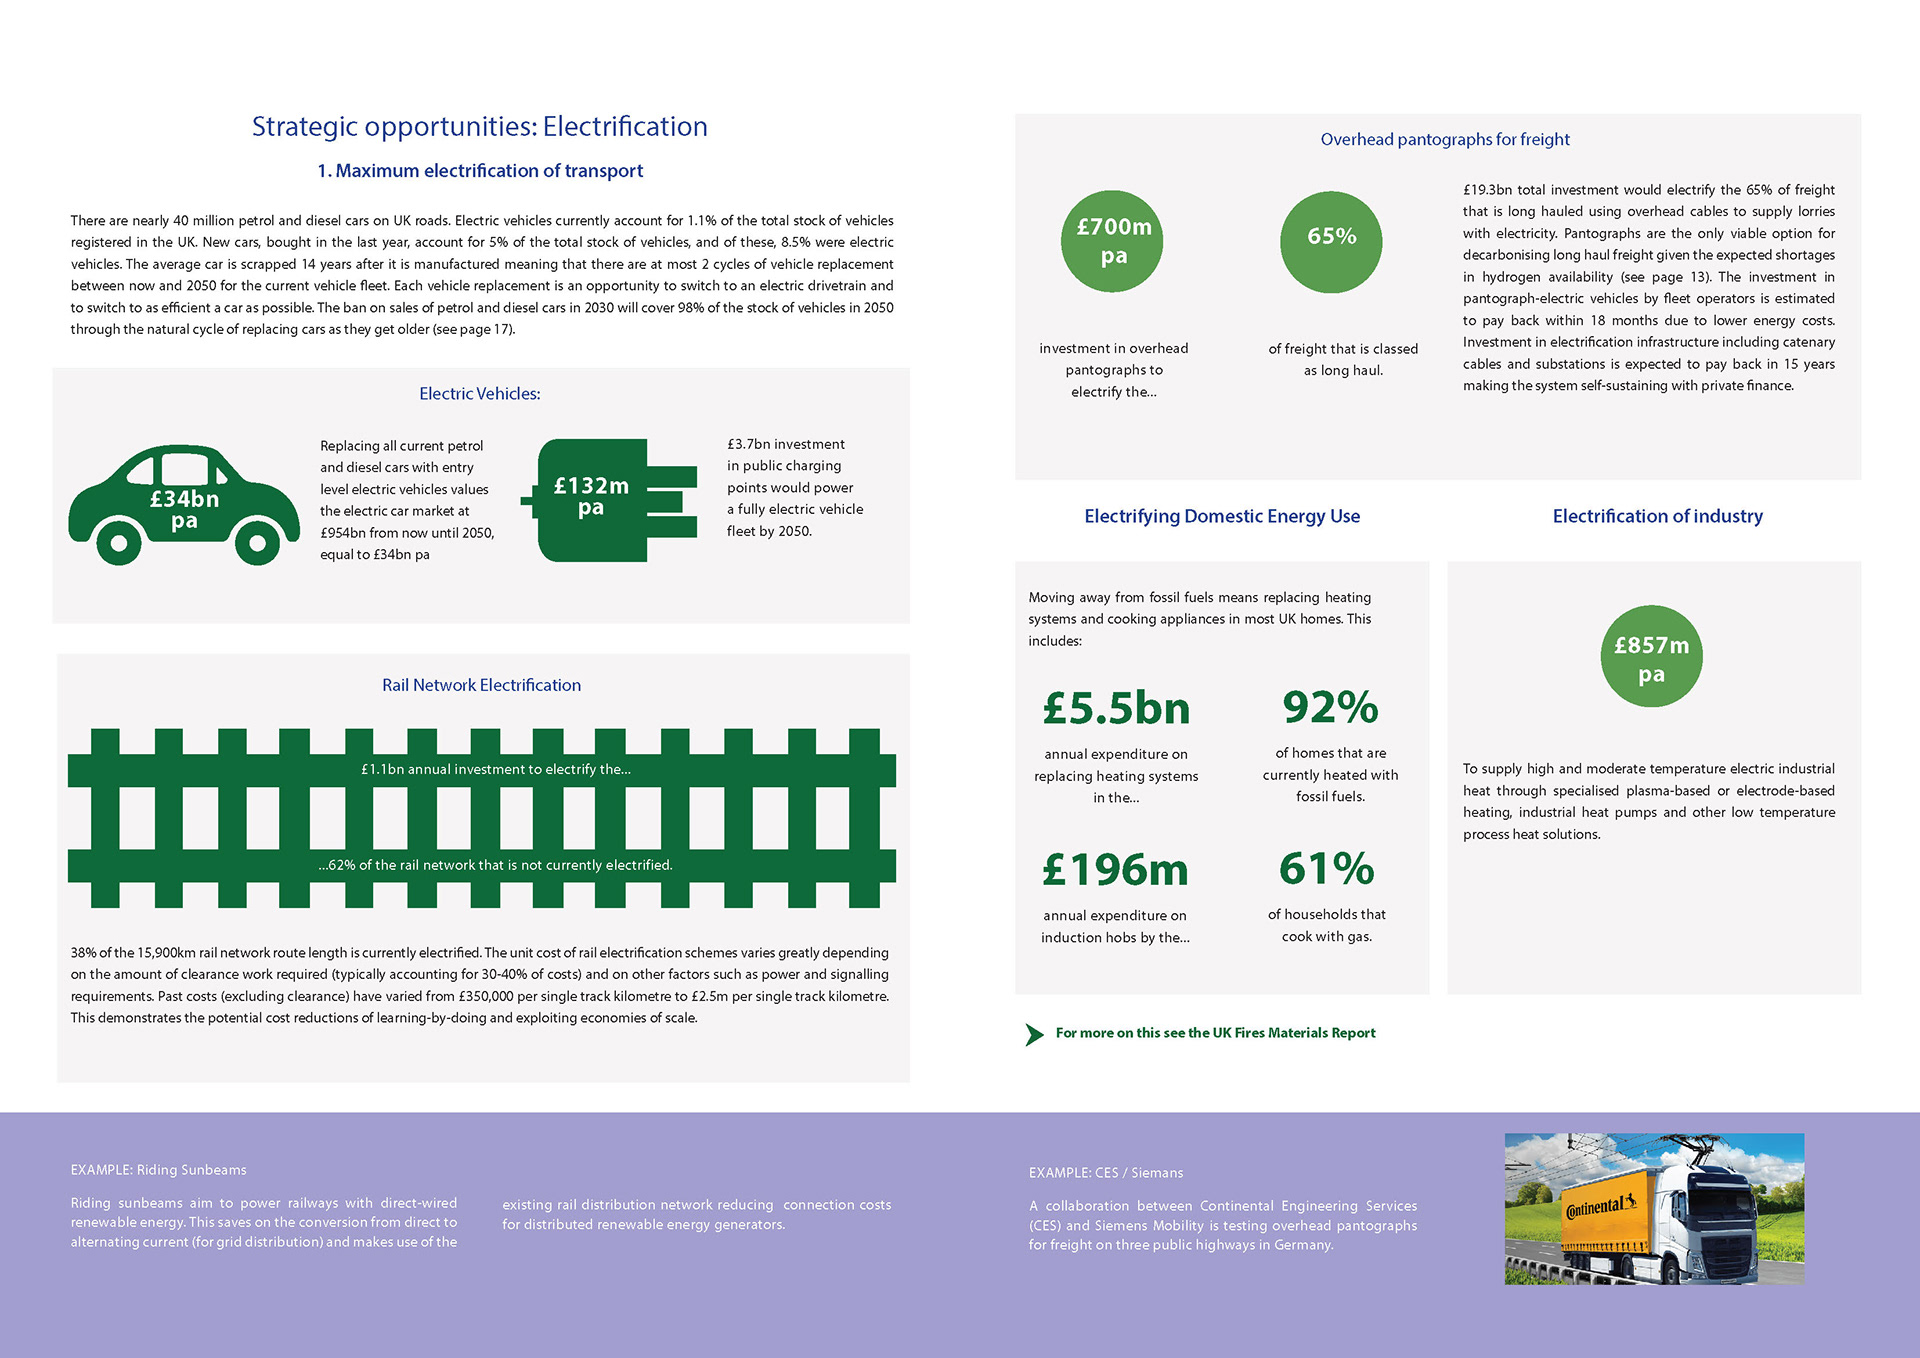
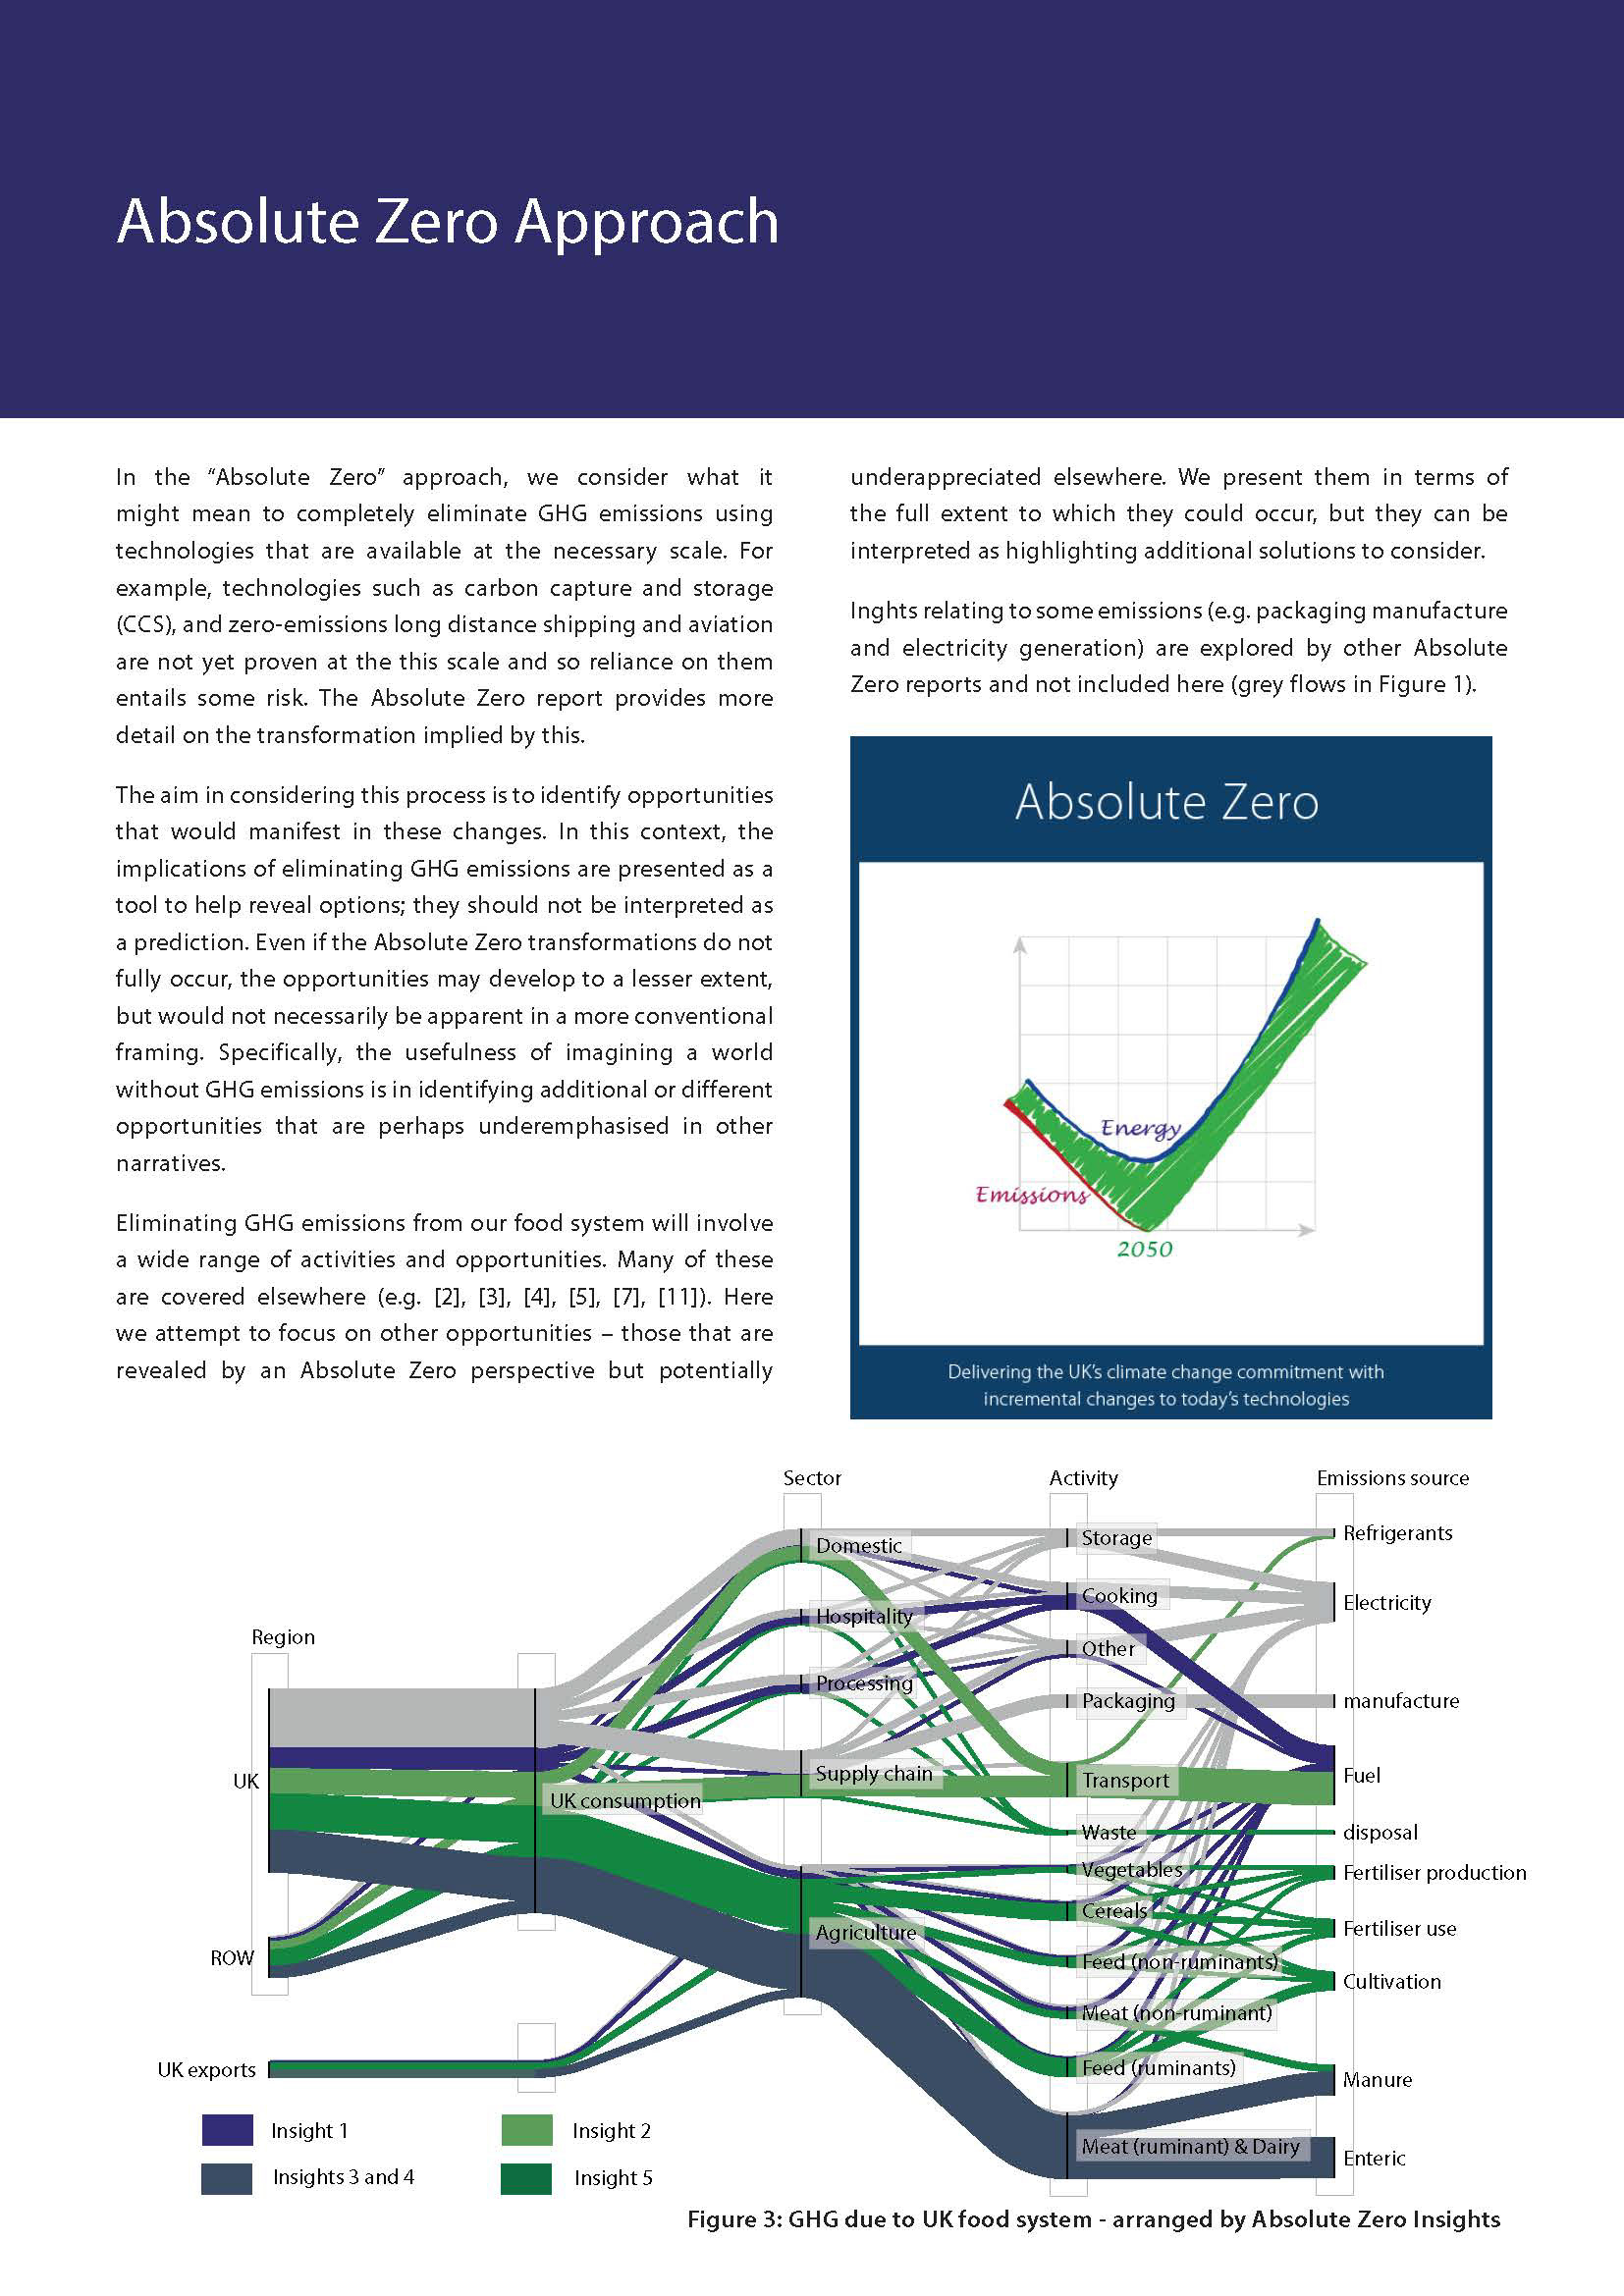
• I regularly use infographics in reports to communicate complex ideas at a glance, with some examples shown below.
• I also led on the UX and design of ZERcalc, an interactive zero-emissions visualiser - from wireframes and storyboards to developer briefing.
• Whether still or interactive, each piece is about making the data speak clearly.


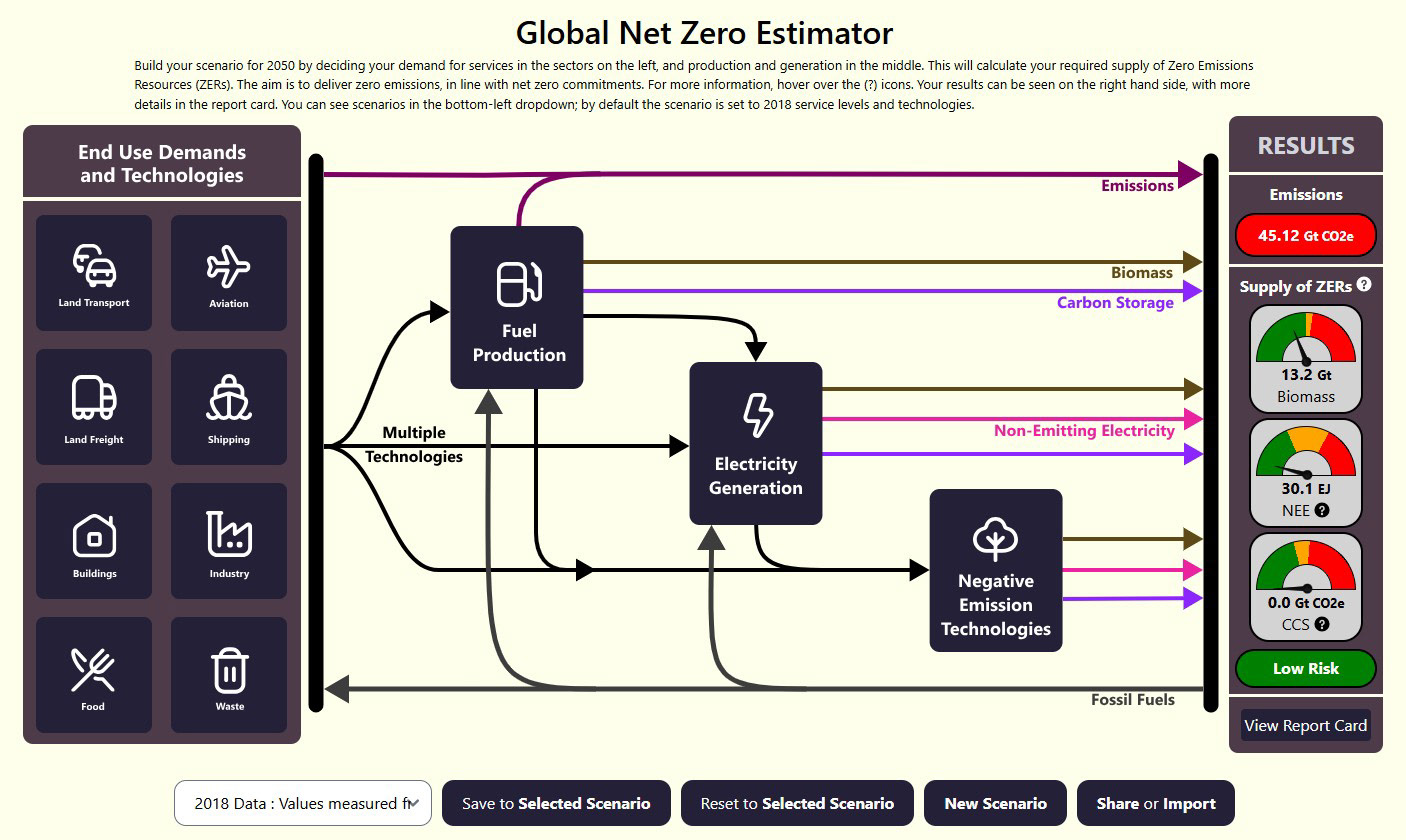
https://zercalc.web.app/


Map boundaries source: World Bank Official Boundaries
Population and emissions sources:
Our World in Data – CO₂ Emissions
For national greenhouse gas (GHG) and CO₂ emissions (total and per capita).
For national greenhouse gas (GHG) and CO₂ emissions (total and per capita).
Our World in Data – Population
For consistent 2023 population figures.
For consistent 2023 population figures.
Global Carbon Atlas
For detailed emissions estimates for smaller countries/islands where available.
For detailed emissions estimates for smaller countries/islands where available.
World Bank Open Data
As supplementary data on GHG emissions and country-specific per capita figures.
As supplementary data on GHG emissions and country-specific per capita figures.
United Nations Statistics Division and CIA World Factbook
For territories and regions without consistent data elsewhere (especially populations of small or disputed territories).
For territories and regions without consistent data elsewhere (especially populations of small or disputed territories).
CCS data source:
Global GHG data: Jones et al. (2024) – with major processing by Our World in Data (https://ourworldindata.org/greenhouse-gas-emissions)
CCS data: Global CCS Institute, Global Status of CCS 2020 (https://www.globalccsinstitute.com/wp-content/uploads/2021/03/Global-Status-of-CCS-Report-English.pdf) and Global Status of CCS 2024 (https://www.globalccsinstitute.com/wp-content/uploads/2024/11/Global-Status-Report-6-November.pdf)